Getting a Better Grip on Guns in Airports

Last month, the digitally minded folks at FiveThirtyEight set out to answer a simple question: How many guns has the United States Transportation Administration confiscated at each U.S. airport? The TSA gave them the answer, in terms of both loaded and unloaded guns confiscated per airport. FiveThirtyEight presented this data as a list of airports, ranked in descending order by total guns confiscated. They then drew some general conclusions from the data, as presented (e.g., “Airports in Texas and Florida dominate the list” and “Do a quick gun-check the next time you’re about to head to the airport, it’ll save us all a lot of time”).
The brief critique of FiveThirtyEight’s post is that the site has added nothing to the understanding of this subject, beyond doing what, presumably, anyone else could do– request the data from TSA and list it in a simple chart– and no more. (Indeed, numerous news sites posted similar reports around the same time.)
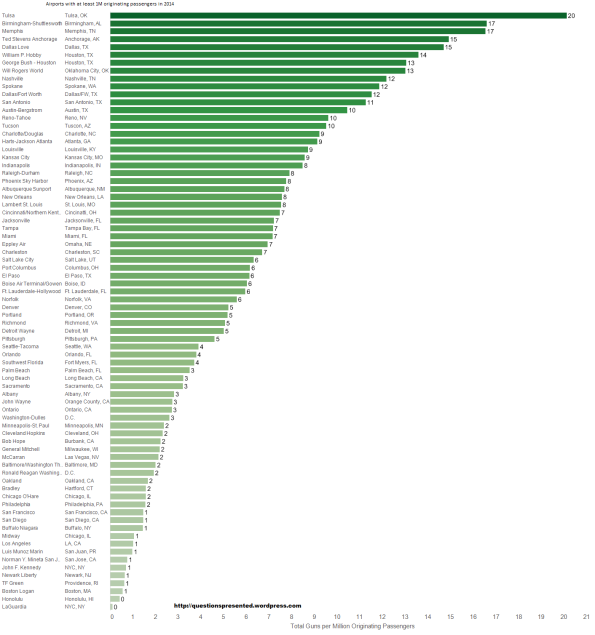
Upon almost immediate reflection, it should be of negligible surprise that the airports that appear atop the list– Atlanta, Dallas/Fort Worth, Phoenix, both Houston airports, and Denver– are among the most heavily utilized airports in the country. Keeping in mind that, in general, the passengers from whom TSA is confiscating guns at a given airport are on flights originating from that airport, the painfully obvious question of actual value to this conversation is, at which airports did TSA confiscate a disproportionate number of guns relative to the number of passengers at that particular airport? With more than a little help from some friends, including readers Mitch and Rusty, the answer to that question follows.
To start, here is a map showing all U.S. airports with at least one million originating domestic passengers in 2014.
Airports marked with red dots are those at which the TSA confiscated an above-average number of guns per million passengers. Conversely, those marked with green dots are those at which the TSA confiscated a below-average number of guns per million passengers. The size of the dot indicates the degree of departure from the per-passenger average in the direction commensurate with the dot’s color.
It is immediately apparent that FiveThirtyEight’s broad conclusion– “Airports in Texas and Florida dominate the list”– was not completely incorrect: the TSA did confiscate an above-average number of guns per passenger at all of the Texas airports shown on the map, but Florida is a mixed bag, and none of the plotted Florida airports greatly departed from the per-passenger average.
What also is quickly apparent is that it is misleading to place Atlanta, Phoenix, Denver (which is just a touch below average), and Tampa at the top of the list, as FiveThirtyEight did. Instead, Tulsa, Birmingham, Memphis, and Spokane look like far more interesting subjects for examination, as do LaGuardia, Logan, Newark, JFK, Midway, and O’Hare, which hold leading spots on the opposite end of the per-passenger-confiscation spectrum.
Here’s a more linear look at the data, with apologies for the color-coding swap:
The next chart is most analogous to FiveThirtyEight’s, with airports ranked in descending order by total guns confiscated per million originating passengers:
How does our list compare to theirs?
If the subject at hand (or in holster) is the distribution of an event across a population, it is not terribly helpful to learn that the event occurs more often in larger population groups. What is helpful, though, is learning where it happens more or less often than expected given the place’s population.
Certainly, there are finer-grain approaches than the one presented above. As one example, it could be beneficial to examine per-passenger gun confiscations as a proportion of licensed gun owners in the region. It also could be beneficial to invert the perspective– so far, most seem to view TSA gun confiscation as a proxy for gun ownership, or, at least, a certain manner of gun ownership– to try to test the efficacy of the security-screening measures at various airports. As an example in that vein, it could be beneficial to know whether it actually is the case that few people attempt to carry guns through security at LaGuardia or just that few actually are caught doing so. The point is that the raw data, by itself, tells us little; it tells us more, however, when we look at it through the lens of other information we already know.
If you want to continue to examine these questions, you can download the full data set Mitch created and compiled, including more maps and charts, here. If you would like to contribute to the 539 Fund, email us at questionspresented[at]gmail[dot]com.


I think that the total number of guns confiscated is an important number, but I agree that the number of guns per passenger is more important. The reason is because, presumably, the number of TSA agents scales with the number of passengers.